LLNL VisIt
Using VisIt to visualise data
LLNL VisIt
LLNL’s VisIt software is a parallel data visualisation package ( LLNL VisIt). EPOCH comes with source code for the plug-in needed to allow VisIt to load the SDF output files which are generated by EPOCH. There are full manuals for VisIt which can be downloaded from the above link so no further details will be given here. To build the plug-in, first ensure that the visit binary is in the $PATH environment variable. Then simply type “make visit” in one of the epoch{1,2,3}d directories. For more experienced users of VisIt, the xml file which is used to generate the plug-in is supplied in the VisIt subdirectory, called SDF2.xml.
Whilst IDL is an excellent tool for visualising 1D and 2D datasets, it
is extremely poor when it comes to dealing with 3D data. For this
purpose, we recommend the use of the "VisIt"
visualisation tool.
The other great advantage that VisIt has over IDL is the ability to render in parallel, enabling the visualisation of huge datasets which IDL would be incapable of dealing with.
- Initially developed by the Department of Energy (DOE) Advanced Simulation and Computing Initiative (ASCI)
- Now developed and maintained by the Lawrence Livermore National Laboratory along with a group of external contributors
- Written in C++ and supports python and Java interfaces
- Available for UNIX (Irix, Tru64, AIX, Linux, Solaris), Mac OS X (10.3 - Current), and Windows platforms
- Open source and freely available under the BSD license
- Plots, operators and database readers are implemented as plugins allowing the VisIt to be dynamically extended at run-time
- Powerful set of tools for manipulating, analysing and visualising 3D datasets
- Parallel and distributed architecture for visualising huge data sets
Obtaining And Installing VisIt
Both the source code and pre-compiled binaries are available for download from the projects web page which is found at the URL https://wci.llnl.gov/simulation/computer-codes/visit
There are full instructions for compiling the project from source code along with build scripts written to help ease the process. However, this is not recommended as it is an extremely large tool and the compilation takes hours to complete. It is usually far easier to download a pre-compiled binary which matches your system architecture.
However, occasionally compilation may be a necessary step. Linux in particular is a moving target and it is not always possible to find a binary which matches the particular combination of libraries installed on your system.
The easiest way to install the VisIt tool is to ask the system administrator to do it for you. However, this may not always be the best option. The system in question may be run by someone who is not concerned with your particular software needs or has insufficient skills to deal with the task. In any case, VisIt has a fairly rapid release schedule and you may find that some functionality you need is not present in the version installed on the machine.
Fortunately, for all these scenarios it is usually quite easy to install
a copy in your own home directory. Just find a binary on the web page
https://wci.llnl.gov/codes/visit/executables.html which
closely matches your machine and download it. This can be unpacked into
your home directory with the command
tar xzf visit2_10_2.linux-x86_64-ubuntu14.tar.gz . The actual name
of the file will vary depending on which version you downloaded. This
will unpack the VisIt binary into a subdirectory named visit/. Now all
that is necessary is to add this to your search path. e.g.
export PATH=$HOME/visit/bin:$PATH
These instructions illustrate the steps required for installing your own copy of VisIt when you have no other choice. VisIt is an extremely large program, so if a version is already available then it is usually better to use the installed version.
The CSC machines at Warwick have a recent version of VisIt installed
which is available via the system. To make use of it you must first
issue the command module load visit.
Compiling The Reader Plugin
One piece of compilation which is almost always necessary is that of the
SDF reader plugin. This is shipped as source code in a subdirectory of
the repository. It is located in the SDF/VisIt subdirectory of the
main epoch directory. The reader will work for any SDF file generated
by any code which uses the SDF I/O routines. You do not need a separate
reader for each version of EPOCH.
To compile, first navigate to one of the epoch*d directories in your
repository. Just type “make visit” and the build scripts should take
care of the rest. The SDF reader plugin will be installed into the
$HOME/.visit/linux-intel/plugins/databases/ directory on your system.
Note that the linux-intel component will vary depending on your
machine operating system and architecture.
Each time you install a new version of VisIt you must recompile the reader to match the new installation. It will also occasionally be necessary to recompile when changes occur to the SDF data format or the reader plugin itself. The developers will notify users if this is the case, although it does no harm to regularly recompile the reader as a matter of course.
We will see later that it is possible to do remote data visualisation with VisIt in which the GUI is launched and interacted with on one machine and the data files are located on a separate machine entirely. In this situation the reader must be installed on the remote machine and must match the setup there. The setup on the local machine is unimportant. In fact it is not even necessary to have the plugin installed on the local machine. This is particularly useful when using a Windows environment to analyse data located on a remote UNIX workstation.
Loading Data Into VisIt
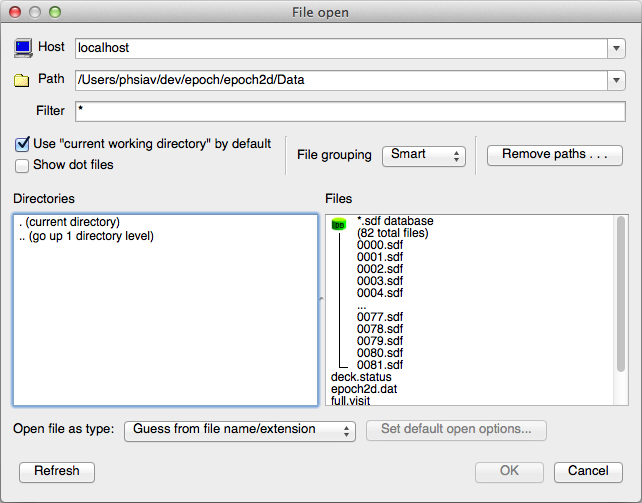
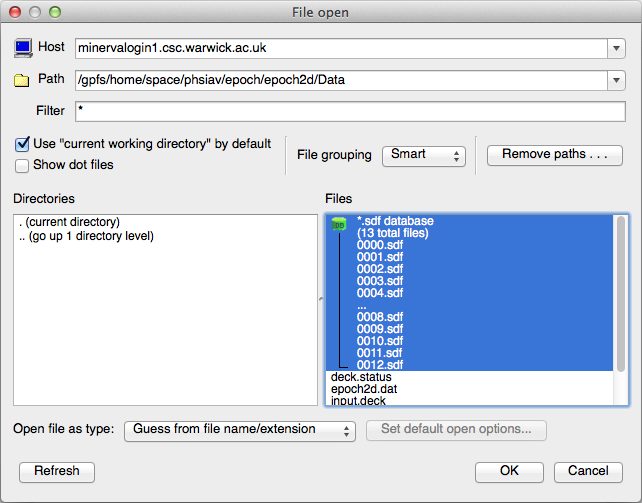
The most straightforward method for loading data into VisIt is to start the application and then browse the filesystem for the dataset you are interested in. This is done by selecting “File ⇒ Open file” from the VisIt menu bar. A file selection dialogue will appear allowing you to browse directories along with the options to filter the results according to a given regular expression and grouping options. By default, VisIt will attempt to group all files containing the same suffix and some kind of numbering system into a sort of virtual database.
The right-hand pane of this window shows a list of selected files which will appear in the main VisIt window when you are finished.
An alternative method of specifying the data file to open is to pass a
command line option when the tool is launched. An example of this method
is visit -o Data/0000.sdf. When the file is specified in this manner
the list of files shown in the VisIt window will also include the full
list of files in the dataset’s subdirectory and all the files in the
current working directory. The other SDF files will be grouped together
in a virtual database.
Yet another method for selecting the dataset to use is by opening a previously saved session file. We will discuss this further in a later section.
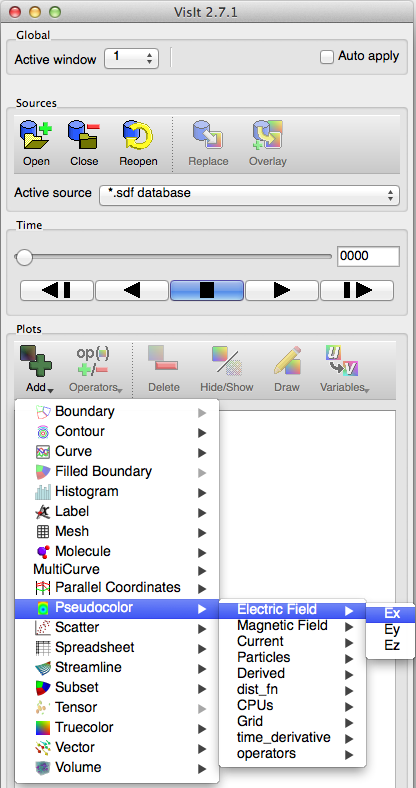
Once an SDF file has been successfully loaded the “Add” menu item will become un-greyed and the cycle numbers for each file in the virtual database will be displayed. If we navigate to one of the plot types we are able to select the variable to plot from a drop-down list.
Contour Plots in VisIt
We will now replicate each of the plots which we generated using IDL in earlier sections. For reasons which will soon become clear we begin with the contour plot and move on to the 1D plot in the next section.
Having opened the same dataset we were using in the IDL discussion we now select the “Add” menu item. Notice that many of the plot types listed here are greyed out and cannot be selected. This is because many of the plots are dependent on the type or dimensionality of the variable to be plotted. If our dataset contains no variables which match the required properties for a plot, the plot menu will be disabled.
For the current dataset there is no “Boundary” plot available since this requires multi-material data and none of our variables meet that criteria.
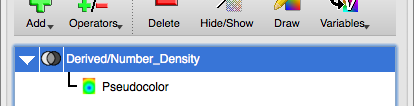
The list contains a menu item for a “Contour” plot. We are not going to select this item since it only generates a contour plot with lines indicating each contour level and not a filled version. Instead we choose “Add ⇒ Pseudocolor ⇒ Derived ⇒ Number Density” and then hit the “Draw” button.
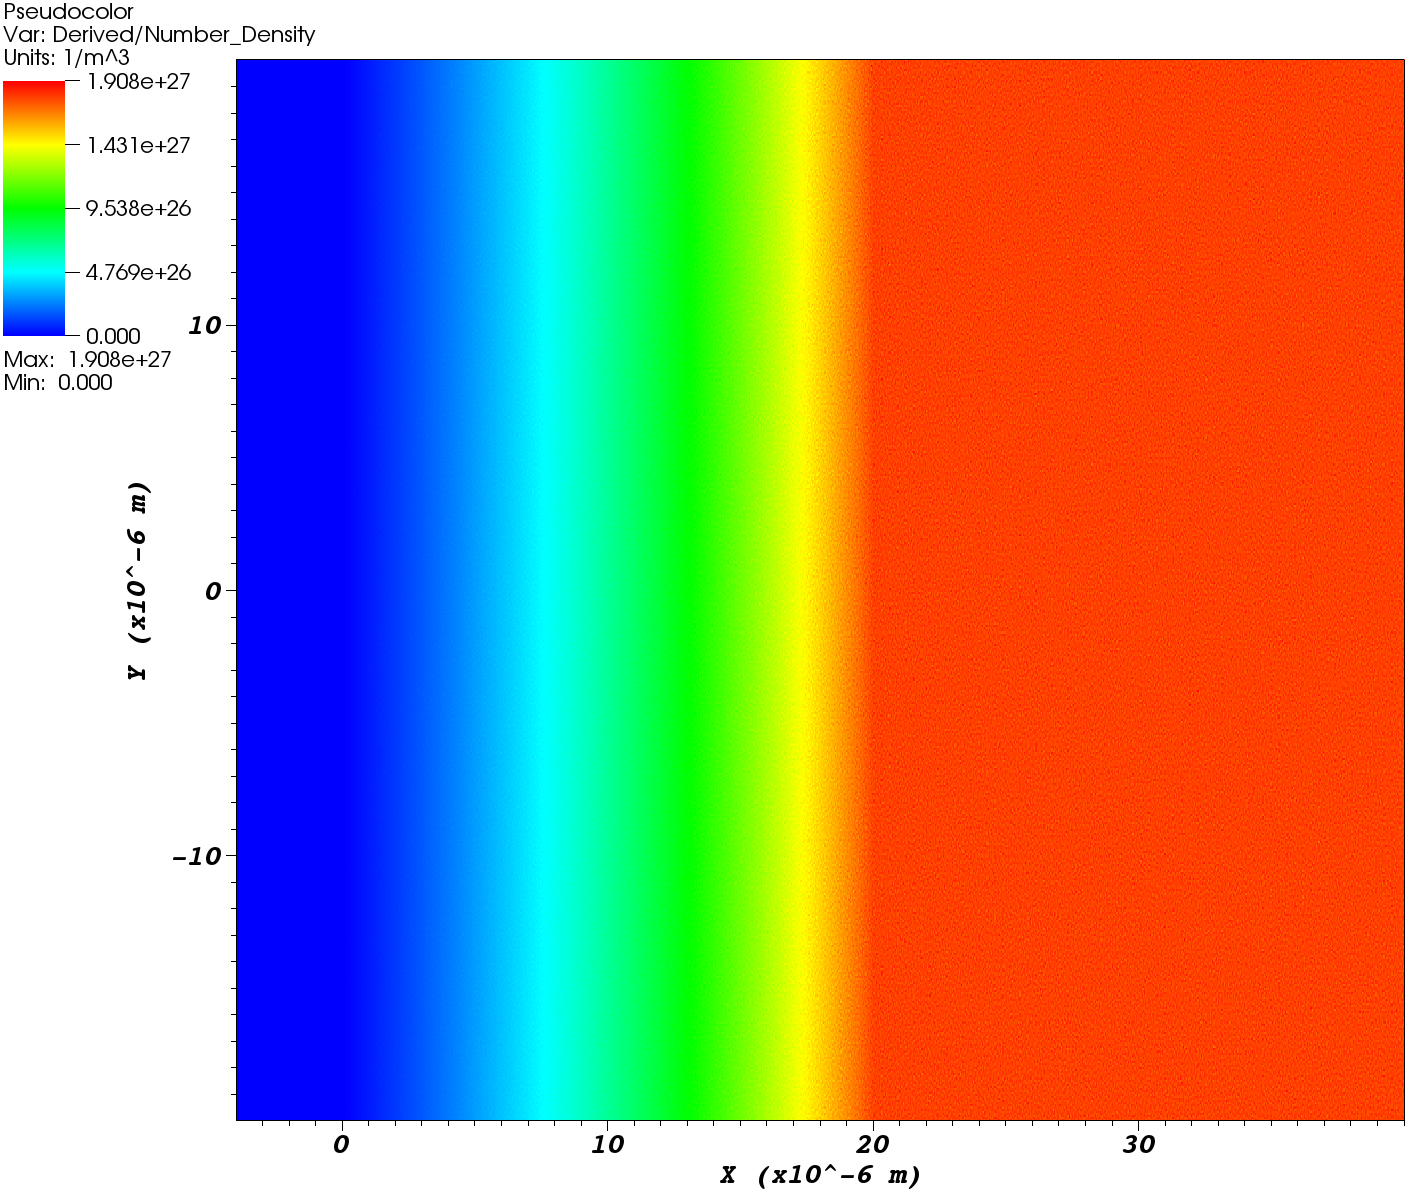
There are many settings which can alter the visual appearance of plots generated by VisIt. The first point of call is usually to open up the “Plot Attributes” or “Operator Attributes” dialogue corresponding to the plot in question. A simpler method for accomplishing this task is to double-click on the plot in the main VisIt menu pane which will launch the corresponding “Plot Attributes” dialogue.
If it is the operator attributes you wish to change, click on the white arrow on the left hand side of the plot in the main VisIt menu pane. This will drop down to reveal a list containing the plot and all operators acting on it. Double-clicking on an operator will launch the corresponding “Operator Attributes” dialogue.
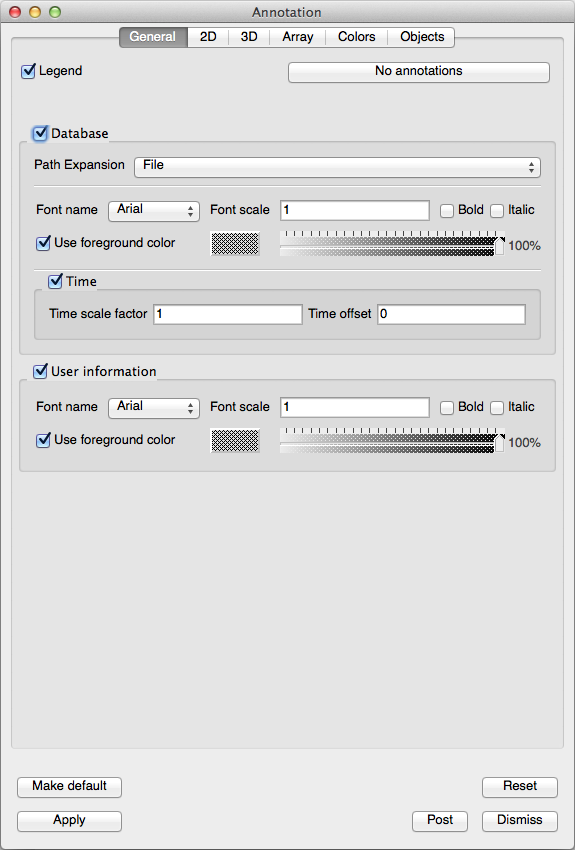
Another important tool for controlling the appearance of plots can be found in “Controls ⇒ Annotation” from the VisIt menu bar. This allows all of the plot annotations to be modified such as the legend, title, axis labels, etc.
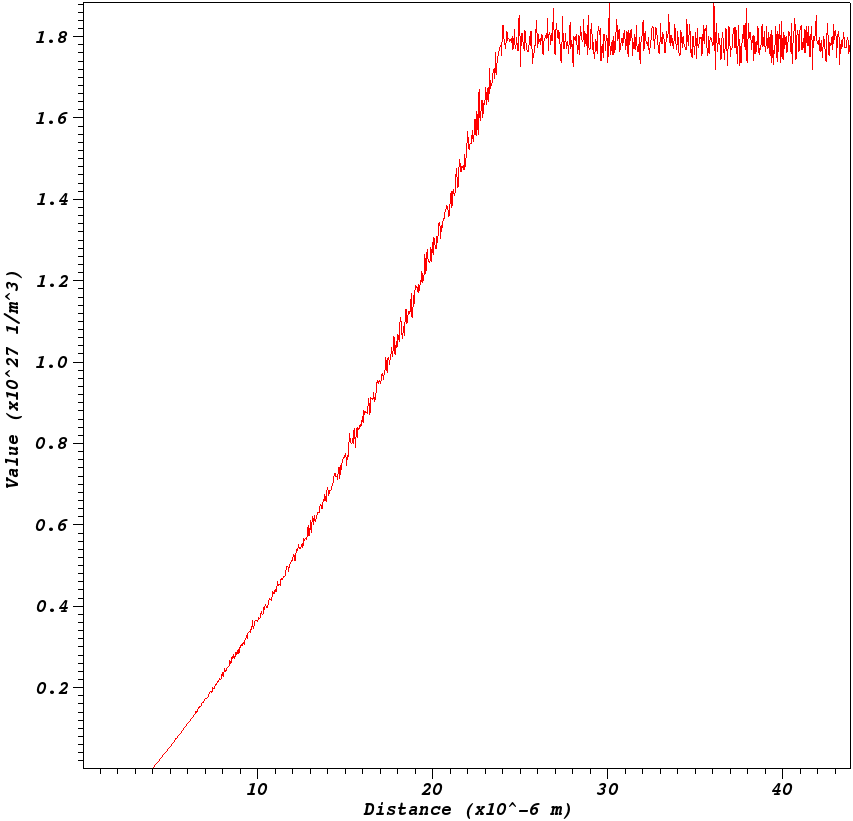
1D Plotting in VisIt
A 1D plot in VisIt is called a “Curve” plot. We already mentioned that this was greyed out because we have no one dimensional variables in our data file.
The solution to this dilemma is the lineout operator which extracts a one dimensional array from a 2D or 3D variable. This operator is selected by pressing the button with red and blue lines located at the top of the plot window.

Once the button has been pressed, we can click and drag anywhere in the “Pseudocolor” plot window. When we release the mouse button a new plot window pops up containing a “Curve” plot of the data just selected.
In order to change the attributes for this plot, we must first select Active window" number 2 in the main VisIt pane.
Shaded Surface Plots in VisIt
Again, we will confusingly refuse to pick the obvious plot type for this task. There is “Surface” plot listed in the menu. However, most of the time the “Elevator” operator does what we want and also gives us more flexibility.
The first step is to do a “Pseudocolor” plot of “Number Density” as we did before. Next select the “Operator Attributes ⇒ Transforms ⇒ Elevate” menu item. In the pop up dialogue click on the “Elevation height relative to XY limits?” and then “Apply”. Click “Yes” when the warning dialogue pops up.
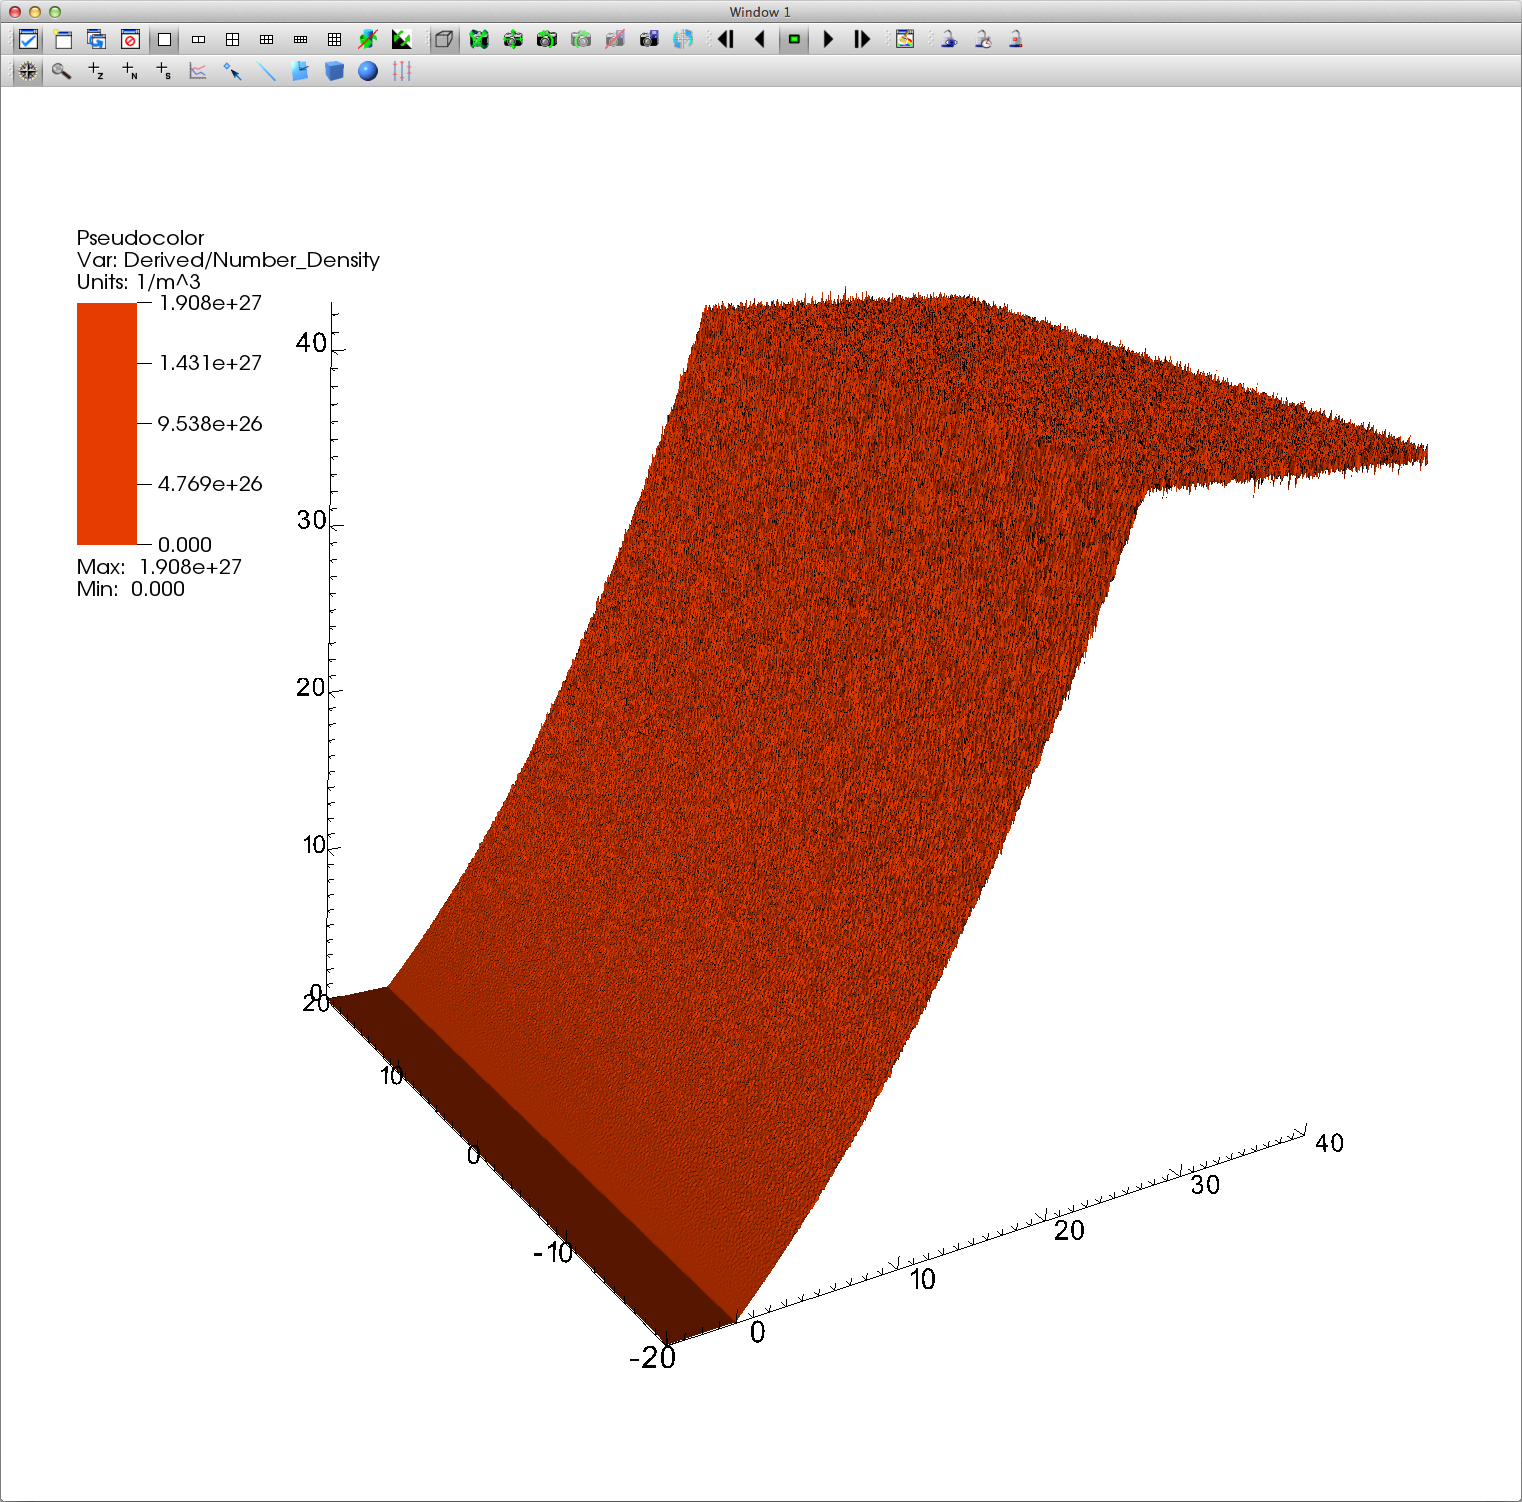
To make this plot look similar to the one generated by IDL, we have changed the colour table using “Controls ⇒ Color table”. We also changed the axis appearance with the annotations menu discussed earlier and changed the height of the elevation using the min and max operator attributes.
Creating User-Defined Expressions
VisIt comes with an extremely powerful method of manipulating data before visualising the results. The basic idea is that an array is transformed by applying a set of mathematical functions on all its elements and then the result is defined as a new variable. Once defined, this variable behaves in exactly the same way as any of the variables read from the data file.
As an example, we can combine the three components of electric field to generate a single electric field vector.
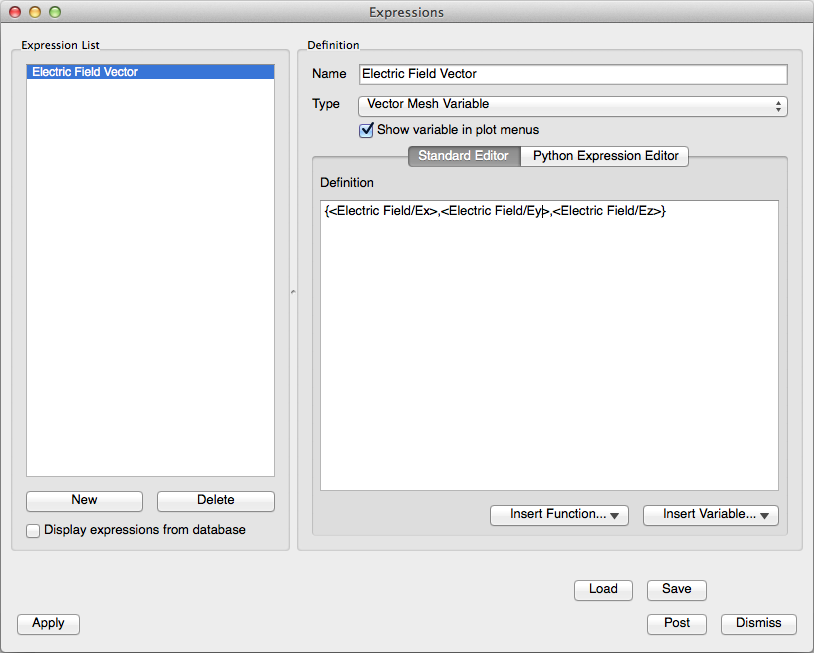
Now when we return to the “Add” menu we see that the “Vector” and “Streamline” and plot types now have an entry for our newly defined vector.
Creating Movies
A compelling visualisation of numerically generated data is often made by combining a series of images into a movie. This can be an invaluable method for illustrating the basic behaviour of a system as it changes over time. Alternatively rotating around a 3D scene can sometimes give a much better idea of the structure in the model being presented. There can also be much to gain by constructing visual fly-throughs of a scene, dynamically slicing through sets of data or combinations of all these techniques.
VisIt provides several facilities for generating movies from your data. The simplest of these is to select the “File ⇒ Save movie” menu item. This pops up a movie wizard which will walk you through the process of generating a simple linear movie based on the time-advancing snapshots represented by your virtual database of files. Alternatively you can select one of the pre-defined movie templates which manipulate the currently selected plot and create a movie from that.
Creating a simple time advancing movie is as simple as walking through the wizard dialogue and selecting from the self-explanatory options presented to you.
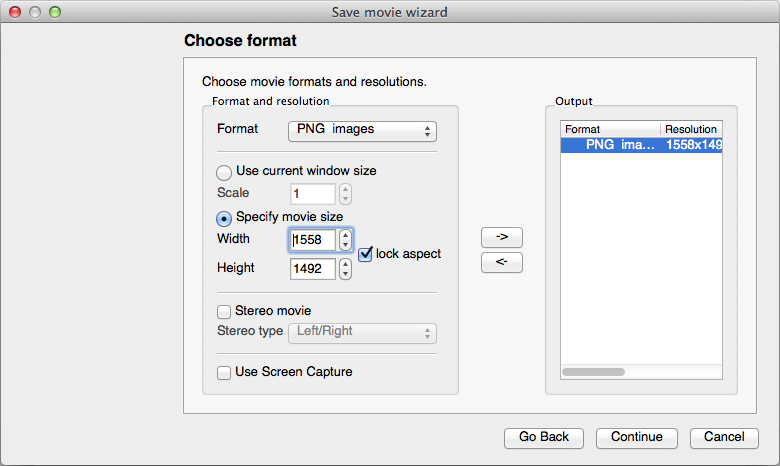
For many uses, the wizard will give exactly the desired results. However it is occasionally useful to have a little more control over how the movie is created. In such cases it can be useful to specify an image format such as “PNG” to save to rather than “MPEG”. VisIt will then generate one image per frame and number them consecutively. At the end of the process the images can be converted into a movie using whatever tool best accomplishes the task.
Another useful tip is to select the “Later, tell me the command to run” radio button. This will output a long command which can run from a UNIX terminal screen. The advantage is that no X session is required so the command can be run in the background. It also becomes a simple task to interrupt the job at any point and resume it from where it left off at a later date. In a similar manner it is easy to resume a job which crashes half way through for any reason.
More complex movies can be created by using VisIt’s keyframing facility which allows you to change animation attributes such as view or plot attributes as the animation progresses. Further information about this somewhat complex task can be found in the on-line help.
Finally, you can use VisIt’s python scripting interface to programmatically describe the details of each frame as the movie progresses. This approach offers far more flexibility in what can be achieved but is also much more involved and time consuming than the previous two methods. Again, further information on this subject can be found in the on-line help system.
Remote Visualisation
It was mentioned earlier that it is possible to perform remote visualisation using VisIt. This is a process in which the data files being interrogated reside on a different machine to the one on which the VisIt GUI runs and where the results are plotted.
This method of working can be extremely useful when the data is generated on a powerful machine located in an external environment such as a large cluster. Another common use is when EPOCH is executed on a UNIX machine and the desktop used for visualisation is running Windows.
It is sometimes possible to run a graphical tool on the remote machine
and tunnel the X-server session through to the local machine but this
can be quite slow and unstable. When connecting to a remote VisIt
instance the only data which needs to be sent between machines is the
pre-rendered image and a few simple plotting commands. Naturally, this
can be a much faster approach.
Also, as mentioned before, it is possible to use a machine on which the reader plugin is difficult or impossible to compile for and connect to a machine on which the reader is already installed.
In order to use the remote visualisation facility, you must first set up
a “Host profile” for the remote machine using the “Options ⇒ Host
profiles” menu item. The pre-compiled binaries are shipped with a long
list of pre-defined host profiles. These are unnecessary for anyone not
affiliated and can safely be removed by deleting the directory
$HOME/visit/current/.visit (assuming you have unpacked the VisIt
tarball into your home directory).
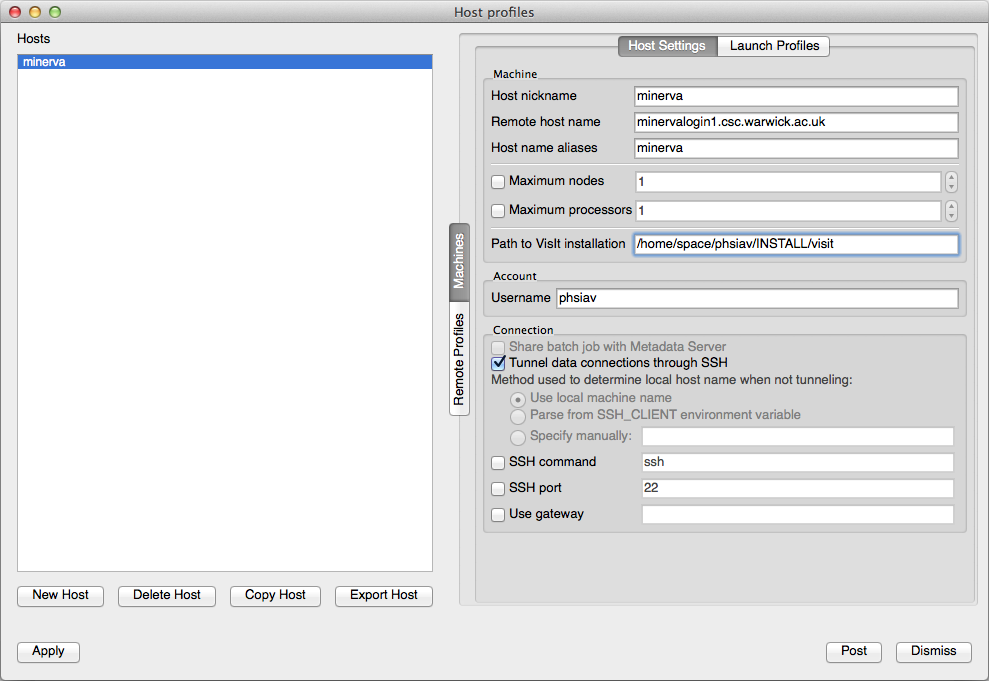
Create a new profile by clicking on the “New Host” button and filling out some of the form fields. The important ones to change are “Host nickname”, “Remote host name”, “Host name aliases” and “Username”. If the visit binary is not in your default search path on the remote machine then you must specify its location by filling in the “Path to VisIt installation” field.
Now click “Apply” and “Dismiss” followed by the “Options ⇒ Save Settings” menu item to ensure that the profile is saved for future sessions.
Data on the remote machine can now be loaded by selecting and picking the desired host profile from the drop down list of “Hosts”. VisIt will wait for the remote process to launch and then continue with the file selection procedure but now displaying files located on the remote machine rather than the local one. From this point on everything should work as before except you should see the name of the remote machine in the “Selected files” dialogue.
Parallel Visualisation
Parallel visualisation is performed in almost exactly the same manner as remote visualisation. Again, you must create a host profile for the purpose except this time you need to set up a parallel launch profile in the “Launch Profiles” tab pane. Click the “New Profile” button, give the profile a name and then set the required options in the “Parallel” tab on the bottom section of the page. Selecting the “Launch parallel engine” radio button will allow you to set the various launch options which relate to the cluster on which the job will run.
The major difference now is due to the fact that VisIt must be launched by an external job script which fits in with the queueing system used by the parallel machine. Usually you will need to consult with the system administrator of the cluster to confirm which launch method and arguments to use.
The details of job launch can be better understood by reading through the “User documentation” section provided at 1 . Of particular help here is the “Getting VisIt to run in parallel” section and the “How VisIt Launching works” entry in the “Developer documentation” section.