Python
Installing the python sdf readers
To install the python sdf readers you need to have an installation of python (2 or 3) with the numpy library. The automated plotting library requires the matplotlib library. Both numpy and matplotlib are available through most system package managers or are installable through pip.
Once you have a working python install, just go into one of the epoch directories (epoch1d, epoch2d or epoch3d) and type
make sdfutils
This will build the SDF python library and install the sdf_helper wrapper and utility layer.
Using the sdf_helper wrapper layer
The low level python SDF library is not user friendly, so a wrapper layer called sdf_helper has been written. This wrapper layer simplifies loading SDF files and provides simple plotting routines using matplotlib.
Importing sdf_helper
Importing sdf_helper is as simple as
import sdf_helper
In these examples, the numpy and matplotlib libraries are usually loaded too, and an alias is created for sdf_helper, so the boilerplate code looks like
import sdf_helper as sh
import numpy as np
import matplotlib.pyplot as plt
Loading an sdf file using sdf_helper
To load a file, use the getdata function. This function takes either a
string which it loads as a filename, so to load the file Data/0010.df
you would run
import sdf_helper as sh
data=sh.getdata('Data/0010.sdf')
or it takes a number which is the dump number, and optionally a second parameter which is the directory name as a string, so you would run
import sdf_helper as sh
data=sh.getdata(10, 'Data')
Because memory is only allocated when needed in the SDF python reader there is no way of specifying which variables to load using getdata. All variables are available when the file is first loaded, and memory is allocated when the variable is first used.
Listing the available variables in an sdf file
To see what variables are available use the list_variables method
import sdf_helper as sh
data=sh.getdata('Data/0010.sdf')
sh.list_variables(data)
This produces an output that looks something like
CPUs_Current_rank <class 'sdf.BlockPlainVariable'> [0]
CPUs_Original_rank <class 'sdf.BlockPlainVariable'> [2]
Current_Jx <class 'sdf.BlockPlainVariable'> [400]
Derived_Charge_Density <class 'sdf.BlockPlainVariable'> [400]
Derived_Number_Density <class 'sdf.BlockPlainVariable'> [400]
Derived_Number_Density_Left <class 'sdf.BlockPlainVariable'> [400]
Derived_Number_Density_Right <class 'sdf.BlockPlainVariable'> [400]
Electric_Field_Ex <class 'sdf.BlockPlainVariable'> [400]
Grid_CPUs_Original_rank <class 'sdf.BlockPlainMesh'> [3]
Grid_CPUs_Original_rank_mid <class 'sdf.BlockPlainMesh'> [2]
Grid_Grid <class 'sdf.BlockPlainMesh'> [401]
Grid_Grid_mid <class 'sdf.BlockPlainMesh'> [400]
Grid_x_px_Left <class 'sdf.BlockPlainMesh'> [400, 200]
Grid_x_px_Left_mid <class 'sdf.BlockPlainMesh'> [399, 199]
Grid_x_px_Right <class 'sdf.BlockPlainMesh'> [400, 200]
Grid_x_px_Right_mid <class 'sdf.BlockPlainMesh'> [399, 199]
Wall_time <class 'sdf.BlockConstant'> [1]
dist_fn_x_px_Left <class 'sdf.BlockPlainVariable'> [400, 200]
dist_fn_x_px_Right <class 'sdf.BlockPlainVariable'> [400, 200]
These are the names of the variables in the data structure. This example
is taken from the supplied two_stream.deck example in 1D.
Working with the data in an SDF file
You can access the underlying data using the names obtained from
list_variables
variable = data.Electric_Field_Ex
This returns an instance of either sdf.BlockPlainVariable or
sdf.BlockPointVariable depending on whether you have requested a grid
variable (such as Ex, Ey or a distribution function) or a particle
variable (such as particle momentum or weight). The raw contents of the
variable is a numpy array. It is then available using the data element
of these objects.
import numpy as np
variable = data.Electric_Field_Ex
raw = variable.data
print(type(raw))
print(np.mean(raw))
produces the output
<type 'numpy.ndarray'>
-1.27980874427008e-06
Plotting using sdf_helper
The sdf_helper wrapper script comes with some plotting routines. They
are incomplete currently, but aim to provide as close as possible to
press ready figures in a single command. You need the matplotlib
library to use these routines, and they are only available for 1D and 2D
data at present. To plot data, simply provide an
sdf.BlockPlainVariable object to the routine plot_auto. An example
of plotting a 1D variable, using the two_stream.deck example deck to
generate the figures would be
import sdf_helper as sh
import matplotlib.pyplot as plt
plt.ion()
data=sh.getdata('Data/0010.sdf')
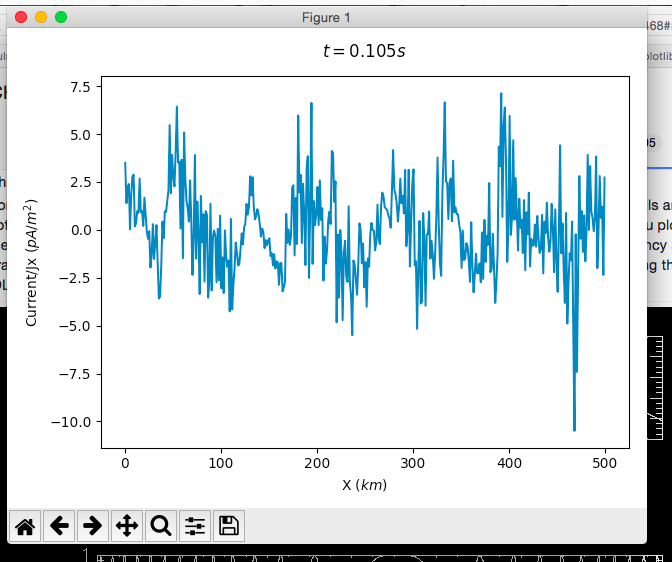
sh.plot_auto(data.Current_Jx)
This will produce a window similar to the image shown here, with slight
difference depending on your version of matplotlib and your operating
system. The code plt.ion() sets matplotlib to interactive mode, so
control will be returned to you as soon as the plot has finished
drawing.
Example 1D plot generated by sdf_helper.plot_auto
Plotting a 2D function is the same basic idea, and the code
import sdf_helper as sh
import matplotlib.pyplot as plt

plt.ion()
data=sh.getdata('Data/0010.sdf')
sh.plot_auto(data.dist_fn_x_px_Right, iso=0)
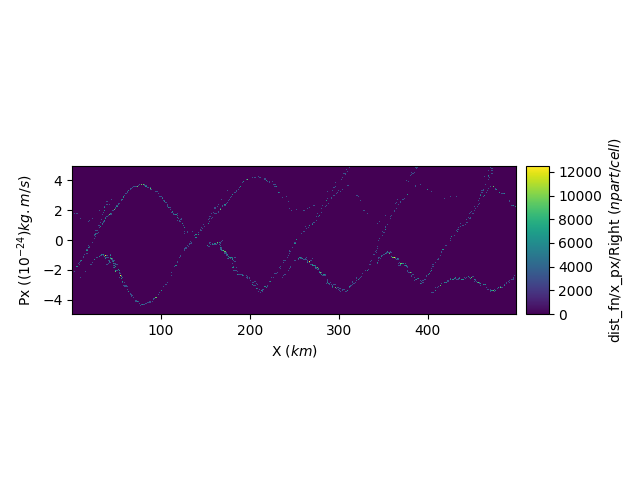
will produce the figure on the right. The procedure for variables from EPOCH2D data is exactly the same.
Changing colour tables
The easiest solution to changing colour tables is to set the global colour table. This is done by
import matplotlib.pyplot as plt
plt.set_cmap(tablename)
where tablename is a string describing the colour table to be used.
The available strings are given
here
Some bugs in matplotlib
There are some bugs in matplotlib which can mean that sometimes the 2D
images don’t render properly. If you get incorrect rendering, please
try updating matplotlib to the latest version for your platform. If that
doesn’t work then pass the parameter compatibility=True to the
plot_auto routine. This may make the plot slightly less pretty, but
tends to work on more platforms.
Core Python library
The SDF python reader allows you to read any SDF file and access any information within the file. It has very few user friendly features to assist working with the files. Some of the methods listed in the section on sdf_helper (notably list_variables) are not available when using the core library. Loading an sdf file with the core library has the following syntax
import sdf
data=sdf.read(filename)
where filename is a string containing the name of the file to be loaded. This returns an sdf.BlockList object
The sdf.BlockList object
The list_variables routine is added by the sdf_helper wrapper, but
you can check what elements are in the file by simply typing
data.__dict__
Which will produce an output like the following example from EPOCH2D
{'Header': {'filename': '/Users/phsiav/dev/epoch/epoch2d/Data/0005.sdf', 'file_version': 1, 'file_revision': 4, 'code_name': 'Epoch2d', 'step': 53, 'time': 2.5293132385759517e-14, 'jobid1': 1552896563, 'jobid2': 376, 'code_io_version': 1, 'restart_flag': False, 'other_domains': False, 'station_file': False}, 'Wall_time': <sdf.BlockConstant object at 0x11a012318>, 'Electric_Field_Ex': <sdf.BlockPlainVariable object at 0x11a012220>, 'Electric_Field_Ey': <sdf.BlockPlainVariable object at 0x11a012128>, 'Electric_Field_Ez': <sdf.BlockPlainVariable object at 0x11a012030>, 'Magnetic_Field_Bx': <sdf.BlockPlainVariable object at 0x117b2ceb8>, 'Magnetic_Field_By': <sdf.BlockPlainVariable object at 0x117b2cdc0>, 'Magnetic_Field_Bz': <sdf.BlockPlainVariable object at 0x117b2ccc8>, 'Grid_Grid': <sdf.BlockPlainMesh object at 0x117b2cbd0>, 'Grid_Grid_mid': <sdf.BlockPlainMesh object at 0x117b2cad8>, 'Grid_CPUs_Original_rank': <sdf.BlockPlainMesh object at 0x117b2c9e0>, 'Grid_CPUs_Original_rank_mid': <sdf.BlockPlainMesh object at 0x117b2c8e8>, 'CPUs_Original_rank': <sdf.BlockPlainVariable object at 0x117b2c7f0>, 'CPUs_Current_rank': <sdf.BlockPlainVariable object at 0x11a015128>}
The sdf.BlockPlainVariable object
These objects represent the variables in the SDF file. It does not fully implement the dict property, so to inspect it’s contents you must use
dir(data.Electric_Field_Ey)
which produces an output like
['__class__', '__delattr__', '__dict__', '__dir__', '__doc__', '__eq__', '__format__', '__ge__', '__getattribute__', '__gt__', '__hash__', '__init__', '__init_subclass__', '__le__', '__lt__', '__ne__', '__new__', '__reduce__', '__reduce_ex__', '__repr__', '__setattr__', '__sizeof__', '__str__', '__subclasshook__', 'blocklist', 'data', 'data_length', 'datatype', 'dims', 'grid', 'grid_id', 'grid_mid', 'id', 'mult', 'name', 'stagger', 'units']
The key elements are data which contains the raw data for the variable
stored as a numpy array, dims which is an array containing the number
of elements in each dimension of the array and grid and grid_mid
which refer to sdf.BlockPlainMesh objects that represent the
grid axes that the variable is to be plotted against. Grid and grid_mid
do similar but different things. Grid is an array of points
corresponding to the edges of the computational cells, grid_mid to the
midpoints. This means that all of the arrays in grid are one element
longer than the arrays in grid_mid. To identify whether to use grid
or grid_mid you must compare the sizes of the variable dims array to
the sizes of the grid and grid_mid sizes and for each axis use
the element of grid or grid_mid that has the same number of
elements.
Important note! - 2D SDF data is loaded into Python rotated by 90 degrees compared to the original Fortran code that generated it.
The sdf.BlockPlainMesh object
Once again you have to use the dir command to output the information
about an sdf.BlockPlainMesh object, for example in EPOCH
dir(data.Grid_Grid)
Which produces output like
['__class__', '__delattr__', '__dict__', '__dir__', '__doc__', '__eq__', '__format__', '__ge__', '__getattribute__', '__gt__', '__hash__', '__init__', '__init_subclass__', '__le__', '__lt__', '__ne__', '__new__', '__reduce__', '__reduce_ex__', '__repr__', '__setattr__', '__sizeof__', '__str__', '__subclasshook__', 'blocklist', 'data', 'data_length', 'datatype', 'dims', 'extents', 'geometry', 'id', 'labels', 'mult', 'name', 'units']
The important element of this block is data which is a tuple of 1D
numpy arrays corresponding to each coordinate axis of the grid.
Plotting a variable using raw SDF and raw matplotlib
- Warning - This is not our recommended suggestion for plotting. We recommend using our helper routines in sdf_helper*
import matplotlib.pyplot as plt
import sdf

data=sdf.read('Data/0005.sdf')
ey = data.Electric_Field_Ey
plt.pcolormesh(ey.grid_mid.data[0], ey.grid_mid.data[1], ey.data.T)
plt.show()